Objectives
The objective of this report is to provide the current statistics relating to marine protected areas (MPAs) inshore of the outer (12 nautical mile) limit of New Zealand's Territorial Sea.
Concepts
In 2005, New Zealand released its Marine Protected Areas Policy and Implementation Plan (MPA Policy), the objective of which is to: "Protect marine biodiversity by establishing a network of marine protected areas that is comprehensive and representative of New Zealand's marine habitats and ecosystems" (Department of Conservation and Ministry of Fisheries 2005).
A range of management tools may provide protection to marine biodiversity. An MPA protection standard was developed to determine which management tools contribute to the above MPA policy objective (Ministry of Fisheries and Department of Conservation 2008). The MPA protection standard describes two types of MPAs: Type 1 MPAs (marine reserves) and Type 2 MPAs (other management tools that meet the protection standard).
In 2011, an assessment was made of the areas managed by all tools in New Zealand's Territorial Sea, to inventory the existing marine reserves (Type 1 MPAs) and also determine which other tools met the MPA protection standard and could be considered to be Type 2 MPAs (Department of Conservation and Ministry of Fisheries 2011).
New Zealand's Official Statistics System has identified a suite of key official statistics that are performance measures for New Zealand and are known as "Tier 1 Statistics". Tier 1 statistics:
- are essential to central government decision making
- are of high public interest
- meet public expectations of impartiality and statistical quality
- require long-term continuity of the data
- provide international comparability in a global environment.
A list of Tier 1 Statistics and the agencies that produce them can be found on Statisphere website.
In 2011, the area of marine protected areas was identified as a Tier 1 Statistic, with the Department of Conservation and the Ministry for Primary Industries as producing agencies. This report complies with the Principles and Protocols for Producers of Tier 1 Statistics (Statistics New Zealand 2007) and provides the current statistics relating to marine protected areas inshore of the outer (12 nautical mile) limit of New Zealand's Territorial Sea, including the area of MPAs, the types of MPAs (type 1 and type 2) and the biogeographic regions within which they are located.
| Biogeographic Region | Total Area (km2) of Marine ReservesA | Total Area (km2) of Type 2 MPAsB |
|---|---|---|
| Chatham Islands | – | – |
| East Coast South Island | 111 | – |
| East Coast North Island | 29 | – |
| Fiordland | 103 | 381 |
| Kermadec Islands | 7,480 | – |
| North Cook Strait | 30 | 241 |
| North Eastern | 89 | 898 |
| Snares Islands | – | – |
| South Cook Strait | 39 | 139 |
| Southern South Island | 11 | 89 |
| Subantarctic Islands | 9,332 | 2,516 |
| Three Kings | – | – |
| West Coast South Island | 174 | 96 |
| West Coast North Island | 32 | 326 |
| Total | 17,430 | 4,685 |
A Areas for marine reserves (Type 1 MPAs) are taken directly from the relevant Order in Council or Act and therefore may differ from other reported figures, particularly those calculated using GIS.
B Areas for other marine protected areas (Type 2 MPAs) are calculated using a "spherical area" in GIS, which takes into account the curvature of the earth. The geodetic data projection used in calculating these areas was WGS 84.
Figure 1: Coastal marine biogeographic regions in New Zealand
Figure 2: Marine Protected Areas in New Zealand - Type 1 (marine reserves) and Type 2 at December 2017:
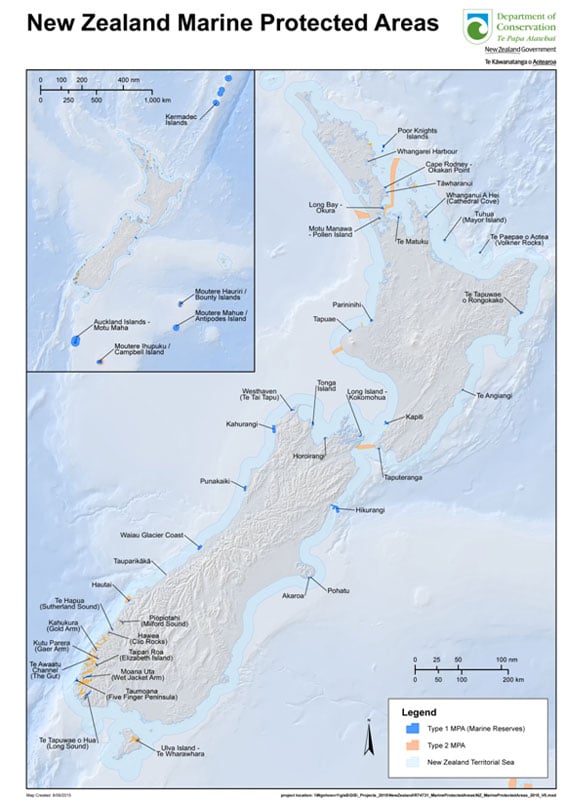
View larger: Map of New Zealand's Marine Protected Areas (PDF, 5,449K).
Survey period
The first marine reserve was established in 1975. The first Type 2 MPA was established in 1966. These areas were not classified as Type 1 or Type 2 MPAs until 2011, when the national inventory of MPAs in New Zealand's Territorial Sea was completed (Department of Conservation and Ministry of Fisheries 2011).
Date of extraction of data
1 December 2017.
Definitions
- Biogeographic region: An area that is defined according to patterns of ecological and physical characteristics in the seascape (Department of Conservation and Ministry of Fisheries 2005).
- Biological diversity (biodiversity): The variability among living organisms from all sources including, inter alia, terrestrial, marine and other aquatic ecosystems and the ecological complexes of which they are a part; this includes diversity within species, between species and of ecosystems (Convention on Biological Diversity).
- Marine protected area: An area of the marine environment especially dedicated to, or achieving, through adequate protection, the maintenance and/or recovery of biological diversity at the habitat and ecosystem level in a healthy functioning state (Department of Conservation and Ministry of Fisheries 2005).
- Marine reserves: Specified areas of the sea and foreshore that are managed to preserve them in their natural state as the habitat of marine life for scientific study. Marine reserves are established under the Marine Reserves Act 1971. Refer to marine reserve information.
- Territorial Sea: The New Zealand Territorial Sea is an area of water not exceeding 12 nautical miles in width which is measured seaward from the territorial sea baseline. Refer to Maritime Boundaries - definition of Territorial Sea Baseline (TSB) on the LINZ website.
- Inshore of the outer (12 nautical mile) limits of the Territorial Sea (additional note): The term “Territorial Sea” has been used (imprecisely) in the 2011 gap analysis report (Department of Conservation and Ministry of Fisheries 2011), and in the Tier 1 Statistic up to 2013, to refer to the marine environment of New Zealand inshore of the 12 nautical mile Territorial Sea limit. The landward boundary of this Statistic is difficult to precisely define, because the boundaries used to define MPAs and the marine environment have varied. While some of the MPAs reported here do extend landward of the Territorial Sea baseline (e.g. into bays, estuaries and river mouths), they extend no further than the landward limits of the “Marine and Coastal Area”3.
Classifications used
Refer to Definitions.
Data source
The classification of management tools as Type 1 or Type 2 marine protected areas is from the gap analysis report (Department of Conservation and Ministry of Fisheries 2011). Modifications of that analysis have been made to account for the establishment of new MPAs since that report was published.
The areas in Table 1 for marine reserves (Type 1 MPAs) are taken directly from the relevant legislative instrument (Order in Council or Act of Parliament). Therefore, areas may differ from other reported figures, particularly those calculated using GIS, including those reported in Department of Conservation and Ministry of Fisheries (2011). Because no area calculations are specified in the relevant legislation for the Hikurangi and Cape Rodney to Okakari Point Marine Reserves, the areas of those MPAs (104.0km2 and 5.6km2 respectively) have been calculated in GIS using the WGS84 geodetic data projection.
The areas in Table 1 for Type 2 MPAs are calculated using a "spherical area" in GIS, which takes into account the curvature of the earth. The geodetic data projection used in calculating these areas was WGS 84.
Additional information on New Zealand's marine protected areas is available in the Ministry for the Environment's Marine Protected Areas Indicator Update (Ministry for the Environment 2012).
Source agency and publishing agency
The source agencies are the Department of Conservation and the Ministry for Primary Industries (former Ministry of Fisheries). The publishing agency is the Department of Conservation.
Major data limitations
Marine protected areas in New Zealand are defined for domestic planning purposes using the MPA protection standard as set out in the MPA Policy. This protection standard is specific to New Zealand, and for the purposes of international comparisons, it should be noted that different criteria or standards may be used for defining MPAs for other purposes or by other jurisdictions.
Analytical methods used
Not applicable to these data.
Discontinuities in time series
The time series is continuous.
Revisions (if any)
There have been no changes in the areas reported for this Statistic for 2017.
Other (rounding, valuations, time of recording etc)
Data are rounded to the nearest km2.
Technical reports available
- Coastal marine habitats and marine protected areas in the New Zealand Territorial Sea: a broad scale gap analysis.
- Ministry for the Environment (2012) Marine protected areas. INFO 655. Ministry for the Environment, Wellington, New Zealand. Available on the Ministry for the Environment website.
References
- Marine protected areas policy and implementation plan.
- Coastal marine habitats and marine protected areas in the New Zealand Territorial Sea: a broad scale gap analysis.
- Marine protected areas: Classification, protection standard and implementation guidelines.
- Ministry for the Environment (2012) Marine protected areas. INFO 655. Ministry for the Environment, Wellington, New Zealand. Available on the Ministry for the Environment website.
- Statistics New Zealand (2007) Principles and protocols for producers of Tier 1 Statistics. Statistics New Zealand, Wellington, New Zealand.
Footnotes
1 Refer to note in definitions.
2 Refer to note in definitions.
3 Marine and Coastal Area (Takutai Moana) Act 2011.