Predicting forest mast events
Introduction
Learn about the tools we use to predict mass seeding events and keep track of the forest food available to native species and introduced predators.When beech forests seed heavily, known as a mast, they can produce up to 15,000 seeds per square metre or 250 kg of seeds per hectare. This provides a bounty of food for native birds and insects. But it also feeds rodents, whose populations grow rapidly and in turn fuel an explosion of stoat numbers . This can be devastating for native species if predators are not controlled.
By forecasting a mast and monitoring tree flowering, we can be prepared to act. We use climate modelling to forecast when a beech mast will happen. We then use satellite imagery to see the extent of beech flowering across the country. This indicates where seed is likely to fall in the coming months.
We use this information to determine what forest sites and threatened species will likely need more protection from predators. We also monitor predator numbers to inform the timing of predator control.
Predicting the timing and intensity of mast events
Climate modelling
We use climate modelling to predict forest masts a year in advance.
Each year we use NIWA’s summer temperature data to predict the likelihood of beech forests seeding, in the following year.
When the summer temperatures during January, February and March are warmer than the previous summer, it is likely beech trees will flower the following spring. This means they will drop seed the following autumn. The difference in summer temperature is called the DeltaT. When the DeltaT is high, seeding is likely.
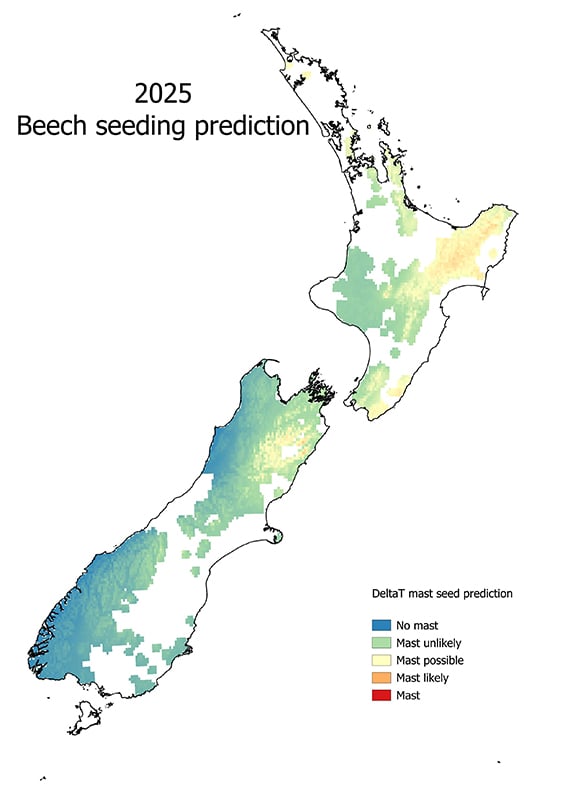
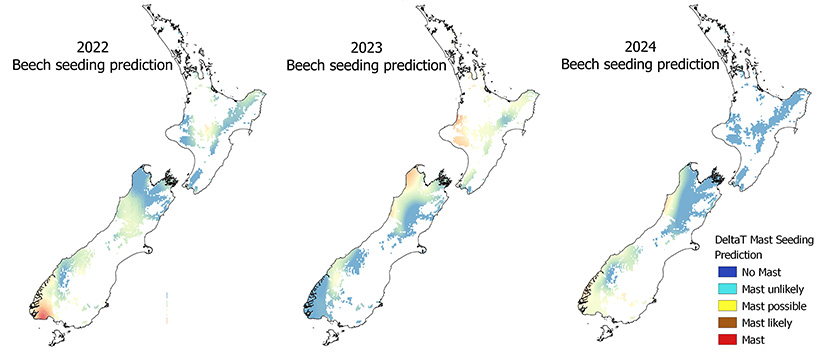
We map DeltaT over our beech forest areas across New Zealand each year. See the map of our mast prediction for 2025 and for previous years below.
Mast prediction for 2025
The DeltaT suggests it is unlikely there will be beech flowering and seeding in South Island beech forests next spring and summer (2024/2025).
Beech seeding or mast is possible in some mixed beech-podocarp forests in the North Island such as Rangataua (southern Ruapehu) and Whirinaki although this is unlikely to be significant.
The map below shows the beech mast prediction for 2025 using the difference in summer temperatures.

Map showing likely mast areas for 2025 | See larger (JPG, 365K)
Past predictions
In 2019 DOC responded to the biggest beech mast in 40 years with predator control over a record 908,000 ha. Smaller but significant mast events also occurred in 2017, 2016 and 2014.
The DeltaT maps below show the mast forecasts for 2022, 2023 and 2024. See also links below for maps of mast forecasts for 2018, 2019, 2020 and 2021.

Maps for all years since 2018:


