The Department of Conservation (DOC) has developed a national monitoring programme to assess the status and trend in biodiversity across all the land it manages, with an emphasis on terrestrial ecosystems. This programme collects data on indicators and measures of ecological integrity, as outlined in DOC's Department's Biodiversity Outcomes Assessment Framework (PDF, 1.07 MB).
The terrestrial monitoring programme has been established at approximately 1400 plot locations that are evenly spaced across Public Conservation Land (PCL). Approximately 280 plots are measured each year, with every plot being measured on a 5-year rotation cycle. This spatially extensive monitoring programme has been designed to provide unbiased, repeatable, national-scale estimates of priority biodiversity indicators and measures.
These biodiversity indicators allow DOC to monitor and report on changes in the structure and composition of vegetation communities, bird species abundance and richness, and the presence and abundance of possum, ungulate (deer, goat, chamois, tahr), hare and rabbit populations across all the land it manages, helping to inform conservation management in New Zealand.
Switch background layer by clicking on the tile at the upper right-hand side of the map. True locations have been randomly modified to protect species and the integrity of the plot.
Daytime bird communities are surveyed at each plot location using a cluster of up to five different bird count stations (at least 150 m apart) between 1 official hour after sunrise and 1300 hours. These surveys used the 5-minute bird count method (5MBC), which provided the following information:
Figure 1. Histogram showing the national distribution of species richness and where the data from this particular plot fit in. Click on any legend button to display data for each bird type (total, indigenous or introduced). Coverclass type (Forest, Non forest, Shrubland) defaults to the value of the selected plot. Choosing an alternative value provides context for how this plot performs against other plots in New Zealand that are most similar to it.
Figure 2. Histogram showing the national distribution of the average bird count and where the data from this particular plot fit in. The data are based on repeated 5MBC surveys in each plot. Click on any legend button to display data for each bird type (total, indigenous or introduced). Coverclass type (Forest, Non forest, Shrubland) defaults to the value of the selected plot. Choosing an alternative value provides context for how this plot performs against other plots in New Zealand that are most similar to it.
| Image | Species | Status | Avg. count | National avg. count | Plots present |
|---|
Nocturnal bird communities are surveyed by deploying multiple acoustic monitoring devices at each plot location. Audio data from up to five different bird count stations (at least 150 m apart) is collected between 2000 hours and 0600 hours. The first 15 minutes of each hour between sunset and sunrise is processed and all species that are heard are recorded. However, here, we only are concerned with the following species: morepork ( Ninox novaeseelandiae), kākā ( Nestor meridionalis), kea ( Nestor notabilis), long-tailed cuckoo ( Urodynamis taitensis), weka ( Gallirallus australis), kiwi ( Apteryx spp.), penguins, little owl ( Athene noctua), Australisan bittern ( Botarus poiciloptilus), crakes ( Porzana spp.), petrels and pūkeko ( Porphyrio melanotus).
Figure 3. Histogram showing the national distribution of nocturnal species richness and where data from this particular plot fit in. These species were recorded by acoustic monitoring devices. Coverclass type (Forest, Non forest, Shrubland) defaults to the value of the selected plot. Choosing an alternative value provides context for how this plot performs against other plots in New Zealand that are most similar to it.
| Image | Species | Plots present |
|---|
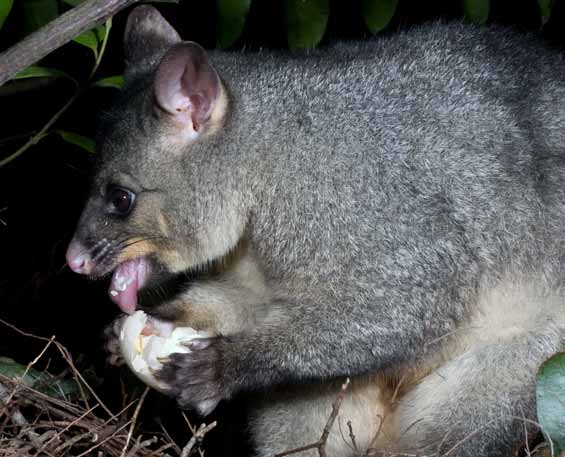
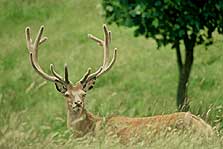
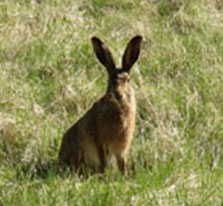
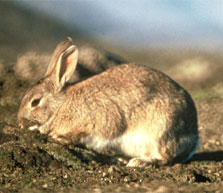
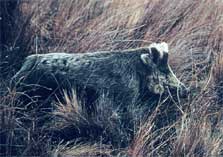
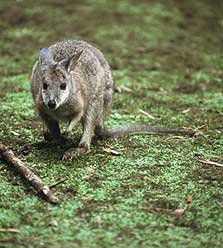
Mammals are surveyed along four evenly spaced 200-m transect lines at each plot location. Mammalian species richness is calculated using multiple methods, including traps, wax tags and chew cards for possums, and faecal pellets and the presence of disturbance from pigs.
Figure 4. Histogram showing the national distribution of indices of mammal type abundance and where the data from this particular plot fit in. Coverclass type (Forest, Non forest, Shrubland) defaults to the value of the selected plot. Choosing an alternative value provides context for how this plot performs against other plots in New Zealand that are most similar to it.
| Image | Species | Present | Plots present | Data type |
|---|---|---|---|---|
|
Possum | Ø | 60% | Traps, wax tags, chew cards and faecal pellets |
|
Ungulate | Ø | 60% | Faecal pellets |
|
Hare | Ø | 60% | Faecal pellets |
|
Rabbit | Ø | 60% | Faecal pellets |
|
Pig | Ø | 60% | Rooting or dung present |
|
Wallaby | Ø | 60% | Evidence of faeces |
Vegetation summaries will be incorporated into this report in the future.
Report created by: Design and Evaluation (D&E), Biodiversity Group, Department of Conservation. This is a work-in-progress and we welcome your feedback. Help improve this report and forward your comments to Design & Evaluation ogansell@doc.govt.nz