![]()
International Visitor Survey results
This measure relates to indicator 3.2.2 – Financial performance of destinations, experiences, facilities and services.
Background
Approximately 3.4 million international visitors aged 15 and over arrive in New Zealand each year, 1.8 million of whom visit at least one of New Zealand’s 13 national parks, according to the Ministry of Business, Innovation and Employment’s (MBIE’s) International Visitor Survey (IVS). DOC is monitoring the numbers and trends of international visitors to these parks.
 52% of international visitors visited one of more of our national parks.
What did we measure?
For each quarter, DOC estimated the numbers and trends of international visitors based on International Visitor Survey (IVS). For visitors who visited the national parks: visitors numbers and their spend were also estimated by their home countries and purpose of visits. Visitors numbers and their trends were also estimated for each national parks.
What did we find?
- 52% of all international visitors to New Zealand visited one or more national parks in the year ending March 2020 (Table 1), meeting DOC’s 2025 stretch goal that ‘50% of international holiday visitors come to New Zealand to connect with our natural places’.
- On average, international visitors who visited a national park spent more money than those who did not (Figure 1).
- Increases in international visitor numbers appeared to be higher among those who visited national parks (Figure 2), with particularly high growth rates for visitors from Asia (Figure 3).
- All 13 national parks have exhibited growth, with particularly high growth rates in some of the parks with the lowest visitation rates (e.g. Rakiura, Kahurangi) as well as two of the most visited parks (Aoraki/Mt Cook and Fiordland) (Figure 4).
Figures
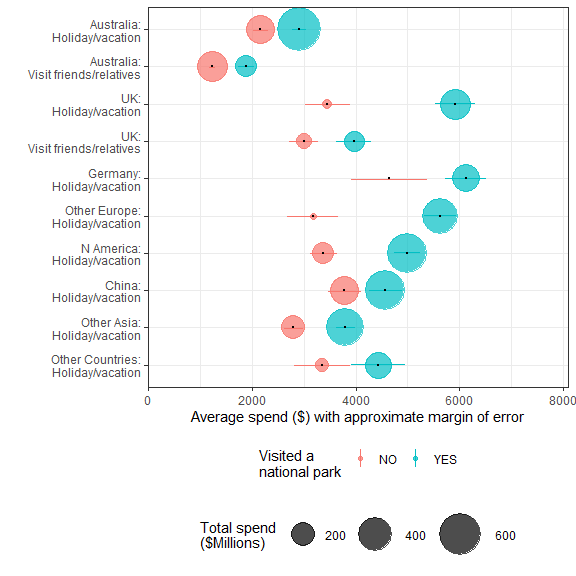
Figure 1: Average total spend by visitors who did and did not visit a national park by country group and purpose of visit for the period from 1 July 2013 (when the new International Visitors Survey began) to 31 March 2020.
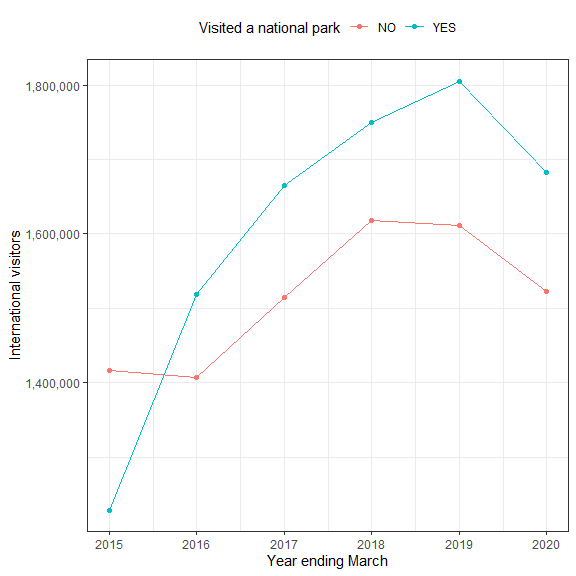
Figure 2: Numbers of international visitors categorised by whether they visited a national park.
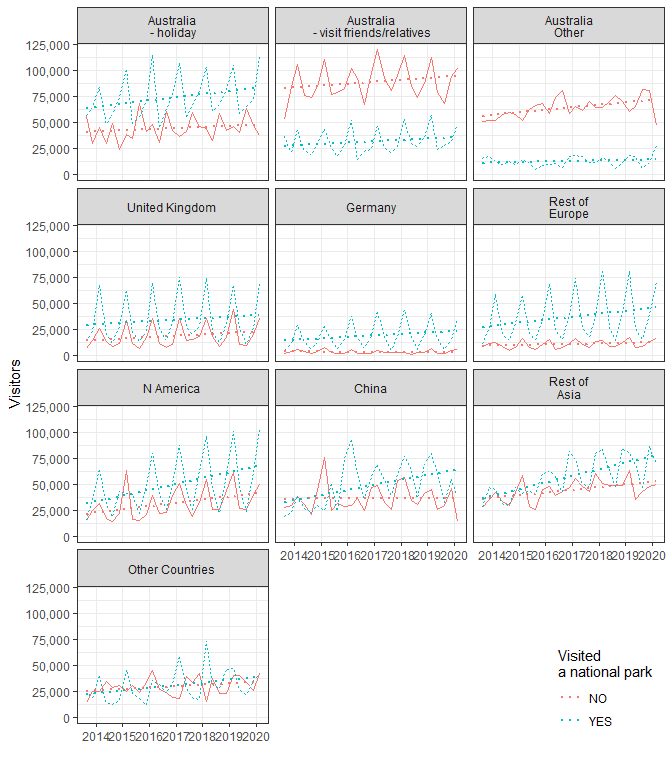
Figure 3: Counts of international visitors who did and did not visit a national park for selected country groups (quarterly estimates).
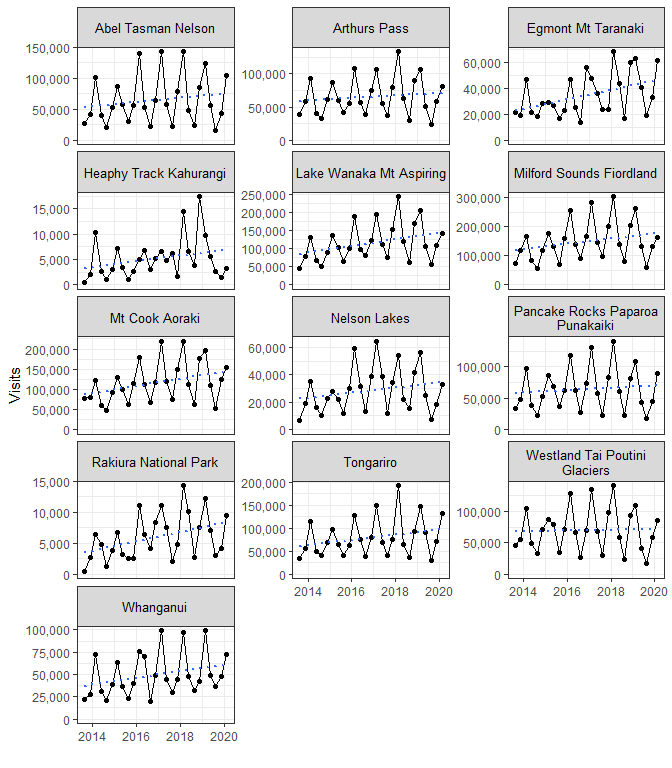
Figure 4: Number of international visitors by national park (quarterly estimates).
Table
| Purpose of visit | Total visitors (000) | Proportion that visited a national park | Total spend ($billions) | Proportion of spend contributed by those who visited national parks |
|---|---|---|---|---|
| Holiday/vacation | 1,648 | 68% | 7.0 | 76% |
| Visit friends/relatives | 910 | 40% | 2.2 | 52% |
| Other | 647 | 30% | 2.2 | 51% |
| All | 3,205 | 52% | 11.5 | 66% |
Data quality
This measure complies with the data quality guidelines used in New Zealand’s Environmental Reporting framework.
The most relevant accuracy metric here is the response rate. The IVS was designed with an expected response rate of 30%.
Glossary of terms
Response rate is the proportion of people who completed the survey as a proportion of the total surveys emailed out (%).