![]()
Visitor safety on DOC’s Great Walks
This measure relates to indicator 3.2.2 - Opportunities, facilities and services provided meet customer expectations and preferences.
Background
DOC invests heavily in the safety of its visitors through communications and visitor infrastructure. One measure of the performance of these efforts is the extent to which visitors’ perceptions and experiences regarding their own safety and wellbeing met their expectations and were consistent with DOC’s messaging.
 79% of respondents agreed ‘a lot’ or ‘totally’ that they felt safe at all times on their Great Walk.
What did we measure?
The Great Walk Guest Survey for 2019/20 comprised an integrated pair of web-based questionnaires that ran for the duration of the each Great Walk’s booking season. The questionnaires included both quantitative and qualitative questions about walkers’ safety perceptions, any safety-related issues and the degree to which they felt responsible for their own safety. Surveys were completed by 2490 visitors.
What did we find?
- A total of 79% of respondents agreed ‘a lot’ or ‘totally’ that they felt safe at all times, while a further 14% agreed ‘moderately’ (Table 1). A similar proportion were satisfied with safety information and structures (Table 2).
- Walkers generally had low rates of encountering safety-related issues, with the most common issues being injury (8%) and needing more clothing or equipment (10%) (Table 3). While only a small percentage recorded fearing serious injury or death, it is notable that 53 respondents had this concern, which may warrant further investigation. Initial exploration found limited support for breaking down these responses by additional factors such as Great Walk or nationality.
- Substantial proportions of respondents from some non-English-speaking countries agreed ‘totally’ that they relied on DOC to keep them safe (Figure 1), despite DOC’s policy on visitor risk management emphasising that visitors are responsible for their own safety and wellbeing and that of others in their care. Since this level of reliance represents a substantial number of Great Walk customers, further research is required to understand this perspective and determine any necessary action.
Tables
| Agree I felt safe at all times | Count | Percentage |
|---|---|---|
| Totally | 729 | 34 |
| A lot | 955 | 45 |
| Moderately | 304 | 14 |
| Slightly | 97 | 5 |
| Not at all | 50 | 2 |
| With safety information and structures | Count | Percentage |
|---|---|---|
| Totally | 643 | 30 |
| A lot | 1080 | 51 |
| Moderately | 290 | 14 |
| Slightly | 80 | 4 |
| Not at all | 34 | 2 |
| Did you or a member of your party/group at any time on the walk | Yes | Percentage |
|---|---|---|
| Need better/more clothing or equipment | 203 | 10 |
| Suffer an injury | 167 | 8 |
| Want to abandon the journey before reaching the end | 116 | 5 |
| Suffer from exhaustion | 71 | 3 |
| Suffer from illness | 69 | 3 |
| Fear serious injury or death | 53 | 2 |
| Suffer from dehydration/heat stress | 41 | 2 |
| Become lost or disorientated | 15 | 1 |
| Need to be rescued/evacuated | 29 | 1 |
| Run out of food | 26 | 1 |
| Suffer from hypothermia | 10 | 0 |
Plot
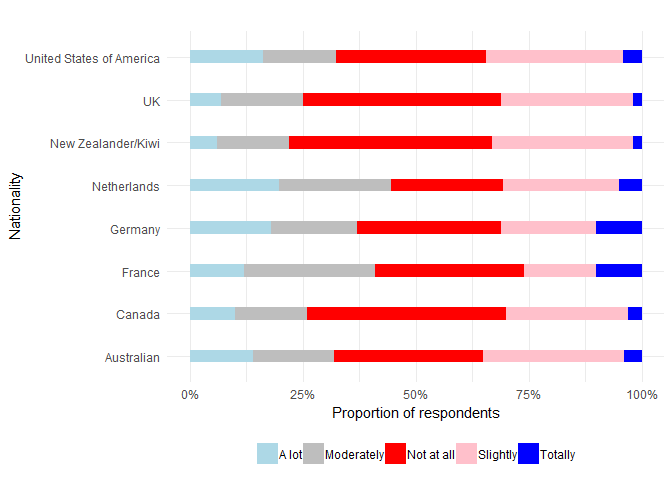
Figure 1: Reliance on DOC safety by nationality.
Data quality
This measure is classified as a partial measure and complies with the data quality guidelines used in the Environmental Reporting framework.
All respondents for the ‘post-visit’ survey were recruited from the population of walkers who provided an email address with their Great Walk on-line booking. They were invited to take the survey immediately after completion of the Great Walk. ‘Pre-visit’ survey respondents were incentivised to also complete the ‘post-visit’ survey. It should be noted that survey respondents did not constitute a random sample of the Great Walk walking population because not all members of the population had an equal opportunity to be selected. All respondents were self-selected. No statistical adjustment was made for these biases.
Additional resources
McGlone, M., Dalley, J., 2015. A framework for Department of Conservation inventory and monitoring: Intermediate outcomes 1-5. Landcare Research Contract Report LC2427 (unpublished) for the Department of Conservation, Wellington.